
Start of our Westbound Flight. The navigation path and current position are shown on the Flight Navigator’s console.
In my previous post, I wrote about the first half of our flight aboard SOFIA, the Stratospheric Observatory for Infrared Astronomy, on the evening of June 25-26, 2013. We took off from the Dryden Aircraft Operations Facility near Palmdale, CA and headed northeast to Moab, Utah, then east southeast to Louisiana and north to Missouri, observing different objects along the way with SOFIA’s 2.5 meter telescope. In that last post, I described how the telescope works, how light passes from the primary parabolic mirror to the secondary hyperbolic mirror, is then angled 90 ° through a pressure bulkhead using the tertiary mirror, and comes to a focus where the instruments are attached. I also wrote about how the FORCAST instrument works and how the guide telescopes help to stay on target. On tonight’s flight, FORCAST was attached to the instrument flange. We had just completed a calibration leg, observing the well-known star Arcturus, or Alpha Bootes.
Just north of Branson, Missouri we turned due west to observe G35.2N IRS 1-1. We were at the midpoint of our flight.
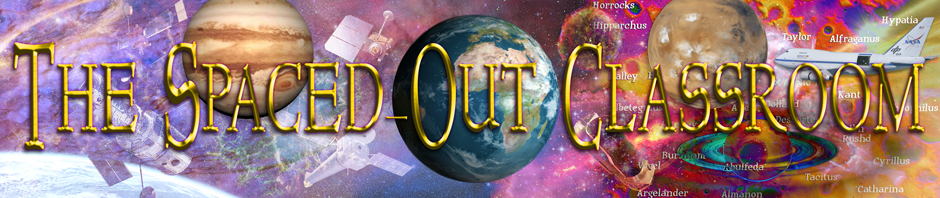
Randy Grashuis, Mission Director for our flight.
Using the Grisms
Since FORCAST splits the infrared beam into two channels, it’s possible to photograph two wavelength bands simultaneously or to photograph one channel while using a grism (a combination diffraction grating and prism) to obtain spectroscopic measurements of the other channel. This is what we did for the next observing leg of our flight. Dr. Alessio Caratti of the Max Planck Institut für Radioastronomie in Bonn, Germany is looking at the spectroscopic lines for hydrogen molecules in massive young stellar objects that are emitting jets of materials. G35.2N IRS 1-1 is such an object.

A copper salt tested in a Bunsen burner flame gives off bluish-green light when heated.
All elements and molecules have specific wavelengths of light that they emit when heated up. For example, potassium glows with a light purplish color, sodium vapor gives off an orange color, copper glows blue or green, and strontium emits red light. In fact, this is how fireworks get their colors. Molecules also have their resonance frequencies where they will absorb energy as the atomic bonds vibrate, flex, and stretch. By looking at the wavelengths that are absorbed or emitted in the gases around proto-stars, one can tell the temperature of the gas as well as its radial motion. For gas moving toward us, the expected absorption lines are shifted toward the blue end of the spectrum. For gas moving away, the spectral lines are shifted toward the red end of the spectrum
Dr. Caratti is measuring the cooler hydrogen molecules in the gas and dust that surrounds these young stars. As an energetic stellar jet slams into this gas, a shock wave is produced that warms up the hydrogen and causes it to emit particular wavelengths of light that are separated out by the grism inside FORCAST. The energy given off by vibration of the hot gases (over 2000 degrees Kelvin) can be observed from the ground, whereas SOFIA can observe the energy emitted by the rotational energy of the cooler hydrogen gas, at about 200 degrees Kelvin. Combining these observations gives a more complete picture of the motion and energy of these proto-stellar jets.

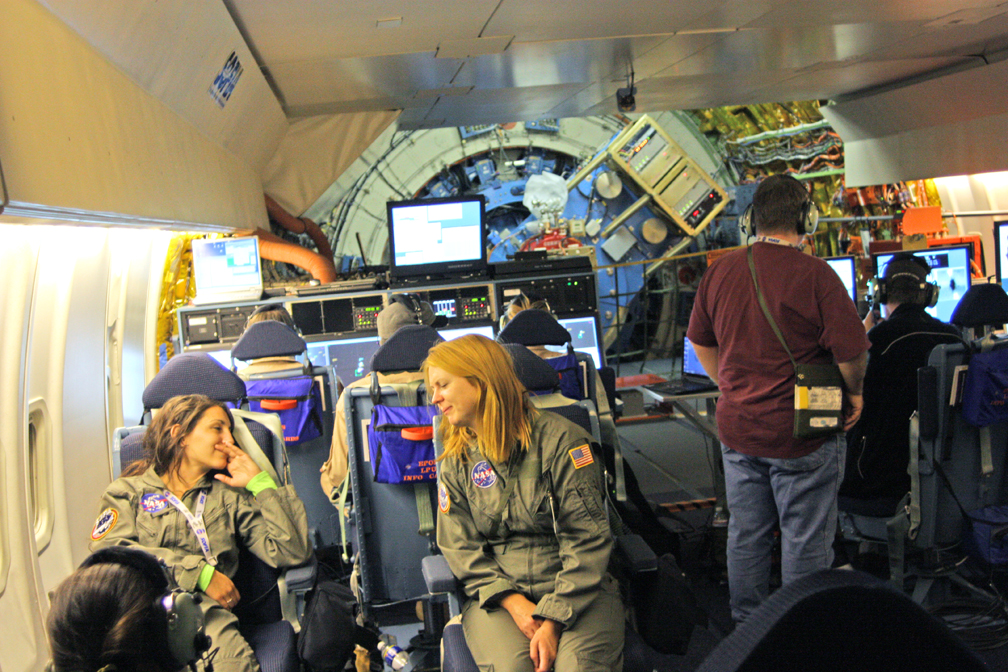
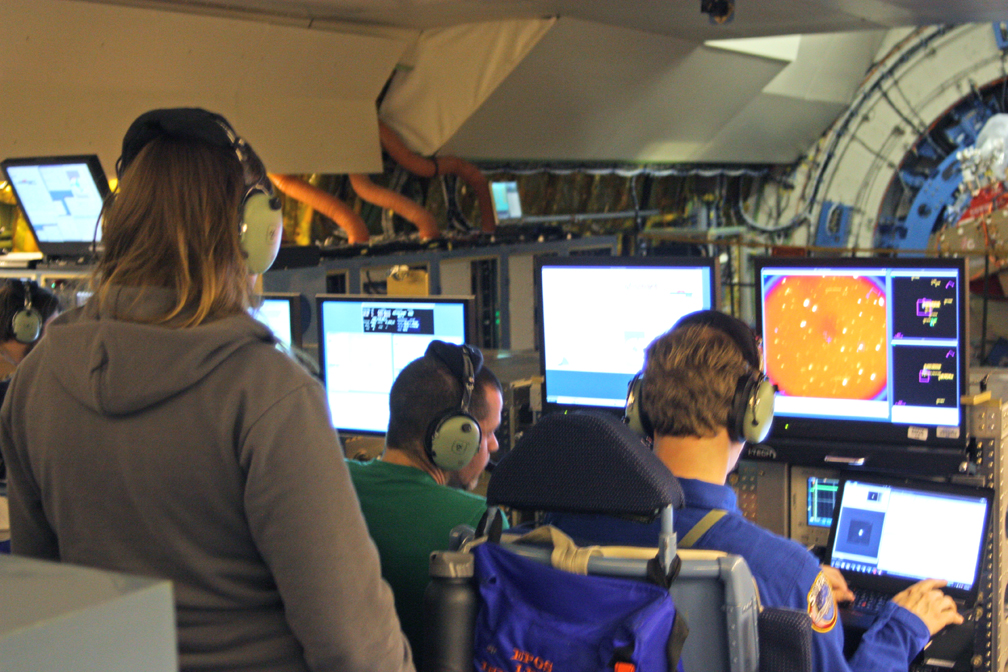
Recording data at the science stations aboard SOFIA. Joe Adams is at right in the cap.
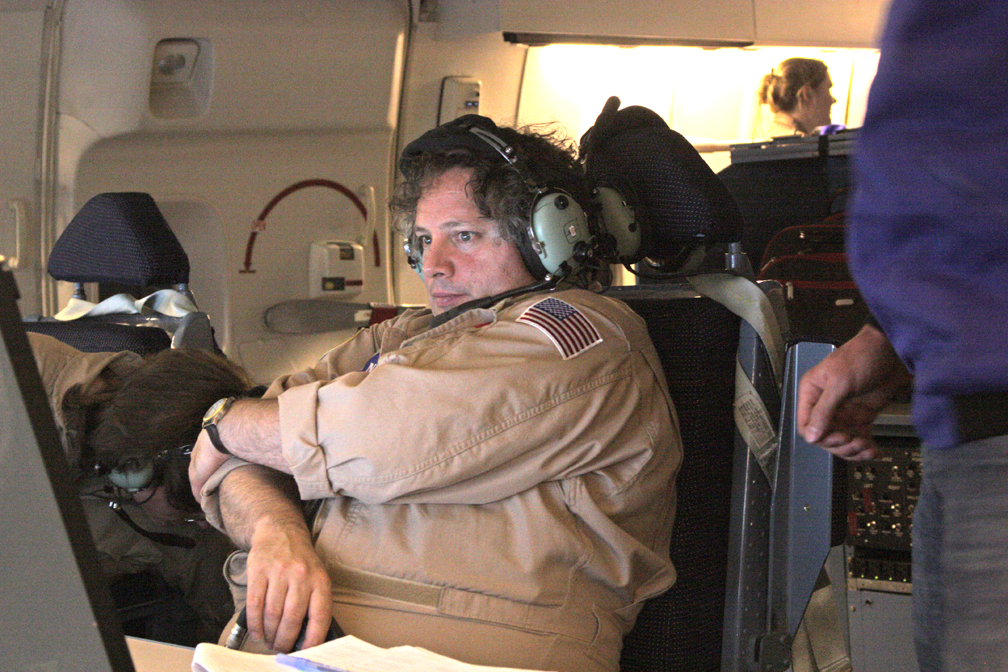
We were getting excellent data. I was invited back to the science station to see the data as it came in. One of the scientists explained what I was seeing. Both channels of FORCAST were seen in grayscale windows on the main science monitor. For this leg, the photographic image was displayed on the right window and the spectroscopic data in the left window. To me, the left window looked like a lot of random noise with a darker band through the center. He told me that that darker band indicated we were getting a good signal through the noise and background radiation, and that the data reduction algorithms should be able to provide good, clean results.
After about 50 minutes of observing this proto-stellar jet, we turned toward the northwest over eastern Colorado to a heading of 294 degrees to start our next leg. I took the time to sit down in the business class seats to eat a sandwich and snack. I had to be careful to keep my blood sugar up during this all-night flight. Rebecca Salvemini and Carey Baxter, the two STAR interns aboard, were also eating “lunch” and we talked about their research projects. Carolyn joined us and we all discussed the teaching profession and its advantages.

STAR interns Rebecca Salvemini and Carey Baxter at the AAA console with Dana Backman.
The Evolution of Preplanetary Molecules
Our next leg was to also use a grism to observe the spectroscopic lines of ices coating dust grains in the molecular clouds from which new stars are born. Professor Douglas Whittet of Rensselaer Polytechnic Institute in New York is looking at the 5-8 micron region of infrared. The grism in FORCAST performed high-resolution spectroscopy of interstellar ice molecules such as water, methane, ammonia, methanol, and formic acid. These ice molecules freeze out inside deep molecular clouds and create mantles around dust grains. As proto-stars form inside the clouds, the ices are heated up and chemical reactions occur that produce more complex molecules. Eventually the evolved ices become incorporated into planets as accretion disks collapse. These processes are of great importance to astrobiology, to see how the molecules essential to life as we know it first formed. The target object for this observing leg was called CK1 (EC 90).
Looking at a stellar jet in two wavelengths of infrared. The image on the right shows the jet as a small dark area up and to the left form the central target star. The left window does not show the jet, as it is visible only through a narrow wavelength band.
A Proto-stellar Jet
We were now at 43,000 feet. As we burned off fuel, SOFIA grew lighter and we were able to climb higher between each leg. We had crossed over the northern arm of the Great Salt Lake, almost directly over where I was at a week before during the astrobiology workshop. I waved to my wife and kids, who were hopefully enjoying a good night’s sleep some 80 miles to the south.
We turned slightly left to a heading of 290 for our next leg. We were to look at another proto-star, this one also blasting a huge jet of superheated plasma into space. The grism was rotated back out of the light path so that both channels could build images. Professor Jonathan Tan of the University of Florida is observing a series of eight proto-stars, looking at stellar jets. He hopes to gather enough data from different stars to test several competing theories about high mass star formation. Our target was G45.47 +0.05, a young star with a prominent jet

At 42,000 feet.
Joe Adams, one of the science team members, showed me the images from both channels on the science monitor, which show up reversed, or the white of stars becomes black and the black of space becomes light gray. In the right window, the jet was plainly seen as a dark smudge pointing up and to the left of the main dark spot of the proto-star. In the left image, which was filtered at a different wavelength, the jet couldn’t be seen but the proto-star was more prominent, as were other features. By picking the right filters, scientists can isolate details such as a proto-star imbedded inside a nebula of dust, invisible at optical wavelengths, or the dynamic swirls of cooler dust surrounding it (such as the jet itself)
Joe also the explained to me why the images required an hour or so for each leg. In infrared wavelengths, there is a great deal of background interference caused by radiation from the atmosphere above us and from the telescope itself. By looking at an object for a longer time, the signal or light from the object builds up and becomes easier to see compared with the background noise.

Chopping between the target and a background area in order to cancel out background infrared interference.
Chopping and Nodding
I had observed in the flight path camera’s monitor window that each star appeared as two blobs connected by thin streaks. The science monitor also showed ghost images of the target as lighter spots above and below the main dark spot. This is caused by a process called chopping and nodding, which helps to cancel out the background infrared radiation noise emitted by the telescope and atmosphere. SOFIA’s telescope has a parabolic primary mirror with an effective diameter of 2.5 meters. The light is focused toward a hyperbolic secondary mirror. This secondary mirror is able to oscillate rapidly between two positions, causing the focal position to shift on the detector. One position is the target itself, the second is an area of the sky close by that has only space in it, or in other words, it shows the background radiation only. The second image is digitally subtracted from the first image, leaving the star showing as a black area in a light gray background. This process occurs several times a second at a rate faster than fluctuations in the air temperature outside the airplane, and effectively cancels out the effects of atmospheric infrared emission. Since the secondary mirror moves back and forth rapidly, it looks like a cleaver chopping vegetables.
A city below us.
To cancel out the effects of the telescope giving off infrared noise, the primary mirror is also moved to a new position slightly off-target every few seconds as the chopping continues. Since it happens at a slower rate, it looks like someone’s head nodding up and down. Altogether four positions are imaged. You can label them Nod A Chop 1 (which is on the target), Nod A Chop 2 (which is off target) and Nod B Chop 1 and Chop 2, which are both off target. By adding and subtracting these images from each other, the final science image is produced. This is why the target is black on light gray with two mirrored white targets above and below it. All of this happens in the telescope hardware and software as we are flying
To use an analogy from my own field of media design, I often have to remove unwanted noise from an audio file, such as background ventilation noise. To do this, the audio file is loaded into an audio editing program such as Apple’s Soundtrack and a section of audio without anyone talking is used to set a print of the background noise. This is similar to the off-target chops. The denoise filter then subtracts the frequencies of the noise from the original clip, hopefully leaving only the sound of the person talking. If the background noise changes over time, several noise prints must be taken over time just as the SOFIA telescope must continuously chop and nod as the air temperature fluctuates outside the airplane.
Taking a break. A conference table will be installed where Rebecca and Carey are sitting on the right side of SOFIA. The telescope control technicians are sitting behind them.
Data Reduction
Joe also explained to me some of the data processing that happens after the flight. The sensors in FORCAST and the other SOFIA cameras are similar to the sensors in regular digital cameras in that they have picture elements in a grid pattern that are sensitive to light intensity, producing a voltage as light hits them. These voltages are read as numerical digits. The FORCAST sensor reads infrared light, which is less energetic than visible light. Defects also occur. Sometimes a particular pixel in the array produces bad data, or additional infrared noise or artifacts creep in, such as internal reflections inside the detector. Shortly after landing the data recorded during flight is transferred to storage and sent to the SOFIA Science Center at NASA Ames in Mountain View, CA. Over the next few weeks, the data is processed and errors reduced or eliminated to get as clean an image or spectrum as possible. From there, the scientists analyze the results according to their original proposals. The data, both raw and processed, is archived for future scientists to use.

Beta Pegasi, or Sheat, in the Great Square of Pegasus.
After 44 minutes of observing on this leg, we had reached almost as far as Portland, Oregon. We turned south-southwest to a heading of 192 degrees. This part of our flight would be another calibration leg, this time looking at the star Beta Pegasi, or Sheat, a red giant star about 200 light years away. It is the upper right star in the great square of Pegasus. At this time of the year, it is visible in the east in the early morning hours, or to our left as we traveled south over Oregon and California.
Using the Data
Once we were set up on the calibration leg, the scientists relaxed a bit. It was a good time to grab a drink of water from the large coolers brought on board or to eat a snack. Some took time to catch a quick nap.

Marissa Rosenberg before boarding SOFIA.
When we went through the egress and safety training the day before, we met Marissa Rosenberg, an astrophysics graduate student studying with Dr. Xander Tielens of the University of Leiden in the Netherlands. His project would be our final set of observations for the evening. Marissa joined us for dinner Monday night and explained her background. She is originally from California and majored in astrophysics, studying in France and the Netherlands along the way. She speaks several languages fluently, and has a pretty good sense of balance. She had waited patiently all night for her turn as a guest investigator.
At dinner the night before, she had mentioned to me a freeware program created to load and analyze .fits files. This is the file format used by NASA to archive most astronomical data, and contains metadata that includes the coordinates, corner position, scaling, wavelengths, and other parameters of the data file.
M16, the Eagle Nebula, as seen in three infrared wavelengths. Image was compiled using DS9 software.
I had already learned how to use .img files last year, which is the data format used for the Mars MOLA and Lunar LOLA 3D altitude data. I had worked out a process to load the .img files into Adobe Photoshop using the Photoshop Raw setting and the file’s label data. From Photoshop I was able to save the image as a 16 bit PNG file, which I could then load into my 3D modeling software as a heightmap. That’s how my students were able to make such amazing 3D images of the moon for our animations.
But now I had the chance to learn how to use .fits files, which had eluded me up until now. Marissa was kind enough to sit down with me and show me the program, called DS9, which allows the .fits images to be loaded into separate red, green, and blue channels. She had some files prepared already, and I was able to create custom RGB images of the Trapezium in the Orion Nebula using different infrared wavelengths. She proved to be an excellent teacher, and I have practiced using this program since returning home. The image shown here is of the Eagle Nebula, or Messier 16, using three different infrared wavelengths as red, green, and blue channels. I’ve photographed this same object before using an optical 24 inch reflecting telescope at Mt. Wilson Observatory, and my photo had about the same size and resolution. This photo shows the familiar beak of the eagle in the bottom left corner, also known in Hubble photos as the Pillars of Creation. But I don’t recall seeing the nebulosity in the upper right corner, which is perhaps only visible in infrared.

Preparing for Marissa’s Observations
Scientists have developed tools like DS9 to read and analyze their astrometric data, both .img and .fits files. NASA scientists don’t like using commercial data file formats, such as .jpg or .psd. They have developed their own set of preferred file formats. The only problem as an educator is trying to find ways to translate these formats into something that can be easily taught and used in the classroom. I’ve used quite a few tools by NASA and other agencies, such as ImageJ by the National Institutes of Health. They are utilitarian in that they work but are not much to look at; scientists aren’t interested in making fancy interfaces. They also tend to assume that you already know how to use them and understand all about the data formats required (and have a degree in astrophysics). Finding tutorials that are accessible for high school students is a challenge, and has become one of the threads of my teaching career. I have high hopes that DS9 will help me finally unlock the .fits format for my students. It can also read non-image data, such as spectroscopic data, and create charts and graphs.

Southward leg, observing Beta Pegasi (Sheat) to calibrate a grism (diffraction grating and prism) in FORCAST.
When Things Go Wrong
After showing me how to use DS9, Marissa was herself shown what to expect during her observation leg by Jim De Buizer and the other science staff. We had reached a point just over San Francisco Bay as we made a short non-observing leg of nine minutes to put us over Monterrey Bay and in line to make her observations. We turned to a heading of 120 degrees.
NGC 7538, in the constellation Cepheus.
With the grism recalibrated, it was brought back into the light path in order to study the spectrum of polycyclic aromatic hydrocarbons, or PAHs. These molecules are made of complex hexagons of carbons joined like a honeycomb and surrounded by hydrogens. They often have a pleasant aroma, and so are called aromatic hydrocarbons. Some examples are chrysene, naphthalene, and benzopyrene. They have been found inside interstellar dust, meteor fragments, comet tails, and are part of the building blocks of organic life. This leg, we were looking for them inside an ultra compact cloud of ionized hydrogen, known as an H-II region, in NGC 7538.
Looking at Marissa’s data
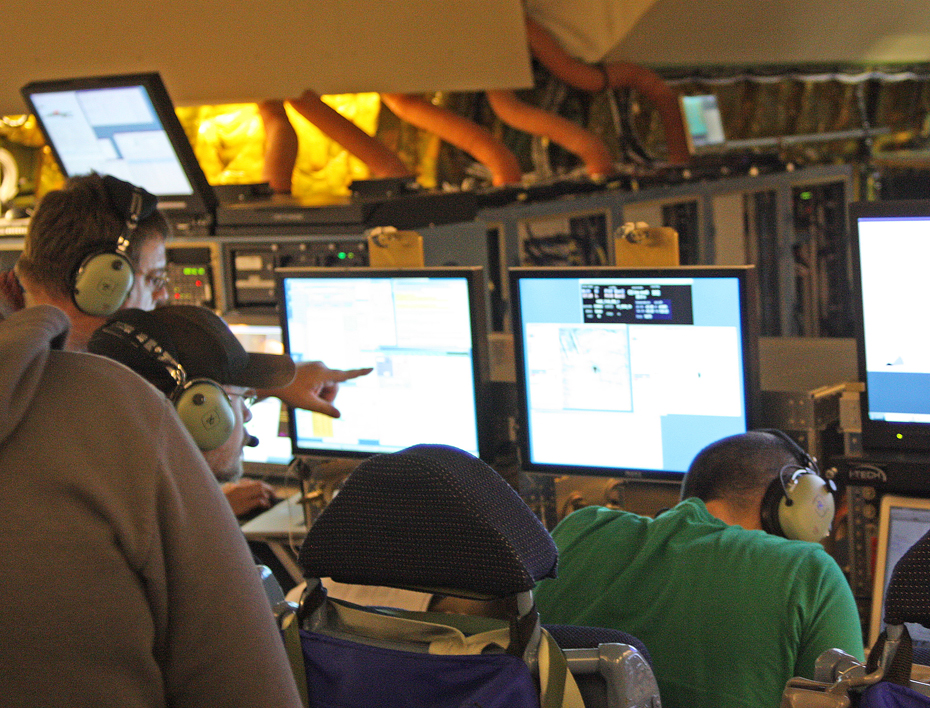
At first, the observations seemed to be going well, but as the leg progressed, one could tell from the increased tension and number of people crowding around the science station that the data wasn’t coming in as planned. I could see that the image in the right channel window had streaks and lines through it as if the chopping and nodding were not cancelling out the background noise completely. Through some of Marissa’s leg, especially toward the end, the mirror was vignetting, meaning it was being blocked by the side of the doorway along one edge. The flight plan showed this as a possibility, saying to return to base as needed.
Marissa looking over the science station monitors as her data comes in.
Jim De Buizer and the rest of the science staff and the mission directors and telescope operators kept a cool head, working the problem, as the pilot would say. They proposed different possibilities for the problem as the leg progressed and tried several solutions. The region we were studying was large, requiring the secondary mirror and primary mirror to chop and nod further than usual to pick up the background signatures. This might also explain the vignetting. It could also have been that since this was the final leg before our landing approach, our heading was more constrained so that the telescope might not have been able to center on the target. We also had to avoid several military no-fly zones.

Discussing the data.
It was a great disappointment for Marissa. She had traveled all the way from the Netherlands to be on this flight, only to have the data not work out. It reminded me just how risky cutting edge science really is. To push the boundaries of what’s known requires instruments that are extremely sensitive and precise, and therefore expensive to build, and complex and finicky to use. Gone are the days when a lone amateur astronomer could simply point a homemade telescope anywhere in the sky and hope to make new discoveries. Putting all of the systems of a jetliner together with all of the controls of a large telescope and its detectors is hard enough. When you add the systems needed to isolate the telescope from vibration and turbulence, you’ve got SOFIA, one of the most difficult technological challenges every attempted. Having most of our observing legs go very well tonight, I forgot just how amazing it is when everything goes right.

Closing the telescope door and preparing to land.
I saw a team of scientists, engineers, and computer programmers working together for a common goal, trying to solve problems using all of their combined experience and talents. They recognize the chancy nature of what we’re doing on SOFIA, and do everything they can to make it all work. I can’t imagine a more fascinating and rewarding career, unless its education, of course.
As for Dr. Tielens, his project will need to be put back into the pool to try again another night, perhaps to look at a different target or after the exact cause of tonight’s problem can be determined and corrected. But Marissa will have to return to the Netherlands without getting get a chance to fly again.

Dawn through SOFIA’s windows as we head back to Palmdale.
Heading Home
Dawn was beginning to streak the eastern sky as we turned for home. We strapped in for landing, and I sat in the front business class seat with Dana Backman, who explained to me how nodding and chopping worked as we made our approach. After landing we had a long taxi back to the DAOF hangar, and I fell asleep after an intense and memorable night.

SOFIA at sunrise after a night’s observations.

Sunrise back at Palmdale, CA and the Dryden Aircraft Operations Facility.
We walked down the steps that were rolled up to the airplane as the sun rose, and walked back to the hangar building as a waning gibbous moon hung in the sky next to the NASA meatball logo. We grabbed some breakfast back at the hotel and headed to our rooms for some well-deserved sleep.
