
The stars in Orion are represented by beads hung in the correct scale of their distances. They form the well-known asterism when viewed from the center of the eyepiece ring, which represents Earth’s position.
Several weeks ago I wrote up a lesson plan as part of a contest sponsored by ORISE, the Oak Ridge Institute for Science and Education. Winners of the contest would receive an all-expenses paid trip to the National Science Teachers Association annual conference in St. Louis. I’m afraid I didn’t win, but it was a great excuse to finally write up my lesson for building a constellation in a box. I’ve been meaning to blog about this lesson for some time.
I’ve written a blog post (and a magazine article for The Science Teacher in Summer 2014) on how to create a 3D model of the nearby stars. When I taught astronomy to 6th grade students at Walden School of Liberal Arts and 8th grade students at American Academy of Innovation, I knew that the nearstar model would be too complicated for middle school students, as it requires using trigonometry functions to calculate correct star positions in the model. So I designed a simpler version that still provides all the learning benefits but is more appropriate for middle grades. Its purpose is to build a 3D model of a constellation in a box with accurate scale in distance but without requiring measurements of right ascension and declination.

The Orion model as seen from a position many light years away from Earth (the center of the canning jar ring). The constellation appears distorted.
I have student teams select a constellation, steering them away from the less exciting ones such as Cancer or Ares or Triangulum. The teams use Stellarium software and the Internet to research the constellation including the story behind it (such as that defeating Scorpio was one of the Seven Labors of Hercules). Then they identify the 7-8 major stars of the constellation and research the meaning of their names, alternate names using Bayer, Flamsteed, and HIP catalogs, their coordinates (right ascension, declination, and distance in light years), and their spectral classes.

Constellation diagrams before taping in their boxes. The students trace these out using Stellarium and a projector and add the star colors, names, coordinates, and spectral types with asterism lines.
I project their constellations onto my white board and the students trace them onto a large sheet of paper that will just fit into the bottom of a box such as a copy paper box or a banker’s box. They circle the stars when they trace, then use markers to color the stars appropriately for spectral types, label each star with name, class, and distance, and draw asterism lines between them. They draw a grid of lines horizontally and vertically every three centimeters, then glue or tape their diagram into the bottom of the box facing up. They lay their box on its side with the diagram turned the right direction. In the open top of the box (now the front), they use thick black thread or string (monofilament works best) to hang a canning jar ring in the center of the opening as an eyepiece. It needs to be secured on both sides as well so that it stays rigid.

6th grade students tracing their constellation on paper using Stellarium to project it on to a white board.
Now comes the calculation part. The students measure the depth of the box from the ring to the bottom where the constellation diagram is located. Let’s say it is 23 cm (which is fairly typical). They then decide which star in their list of 7-8 is the furthest star they will hang. If that star is 500 light years away, it will hang against the backdrop constellation drawing. For the others, divide the furthest star’s distance by the depth of the box, or 500 light years divided by 23 cm, which gives you 21.7 light years/cm as the scale or proportion. Now take the distance of each of the remaining stars and divide it by the scale number to find the centimeters distance to hang that star. For example, if a star is 100 light years away, then using the scale it would be 100 LY/ 21.7 LY/cm which gives me 4.6 cm distance to hang the star from eyepiece.

Students measuring the scale distance for where to hang the star bead from Earth’s position (the eyepiece ring) to the horizontal position of the star in the diagram of Scorpio.
To hang a star, use the diagram at the back of the box to sight into the star. Make a mark on the top of the box directly above that star’s position, then draw a line on the top of the box between where the eyepiece hangs and that point. Measure the scale distance (4.6 cm) along that line and poke a hole in the top (formerly side) of the box with the sharp point of a drawing compass.
To make the stars, use beads of the right colors and sizes for each spectral type and hang them on the same black thread or string. Poke the other end of the string up through the hole in the box and pull up the star bead until it lines up with the star on the diagram as seen while looking through the center of the eyepiece. Then tape it down securely and cut off any extra string. By using a 2D diagram of the constellation, students will not have to worry about measuring the right ascension and declination. Once completed, a typed up version of their star table should be taped across the top of the box to hide the star strings and tape.

The constellation Gemini partially completed. The stars must be lined up with their spots on the back diagram when viewed from Earth’s position (the center of the ring).
Once all the stars are hung, they should form the constellation and line up with the diagram as you look through the center of the eyepiece, such as is shown here with my model of Orion.
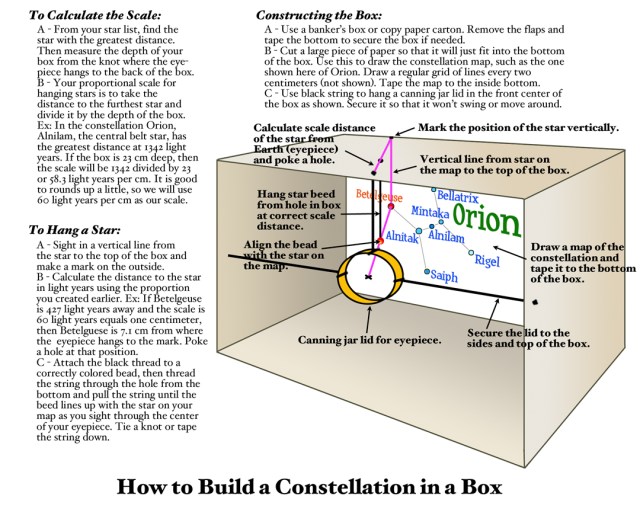
Diagram of the constellation in a box and instructions for hanging the star beads.
Once the models are complete, I have my students use a piece of graph paper to draw out the constellation with its grid. One student looks through the center of the eyepiece with her or his eye against the ring to draw this, then moves his or her eye 5 centimeters to the right. The constellations become distorted as the closer stars seem to move more than the further stars through what we call parallax. The students then draw the constellation as it appears moving the observer’s eyes 10 cm to the left of the eyepiece center then 5 cm up from the center. All four drawings can be placed on the same graph paper using different colors of pencils/pens for each eye position and labeling the main stars. I usually have the students answer some reflection questions or lead a discussion on how constellations are temporary since stars have proper motion through space, and how their appearance would change if we could travel several light years through space. I then have many choices for how to continue or extend this lesson.

Moving the viewer’s position 5 cm to the left produces distortion in the constellation as the closer stars appear to move further to the right. Only Alnilam, the center star in Orion’s belt, appears to not move very much because it is in the far distance next to the back of the box.
I’ve done this activity several times now in three different schools and have modified and improved it. The first time I tried, I had students build their own boxes or frames, which wound up taking far too much time, effort, and materials. Instead, I simply plan ahead and when the school orders more copy paper, I collect the boxes it came in. These are just the right size for this activity.
The NGSS standards that this activity meets include the Crosscutting Concepts of Scale, Proportion, and Distance and Using Models in Science. It also teaches the Earth Science and Astronomy Disciplinary Core Ideas of stars, spectral types, coordinates in space, and constellations. This activity is also good for global awareness as you can have students use non-Greco-Roman constellations such as The Wain or The Wagon instead of Ursa Major, etc., and have them look up alternative mythologies and star names.

A completed diagram of Gemini with the original constellation as seen form the center of the eyepiece (Earth’s position) and from other locations as shown by different colored markers. Castor and Pollux move much more than Wasat because they are closer to Earth and there is more parallax as a result of the change of the observer’s position.
You can extend this activity to have the students chart their stars in the H-R Diagram Lesson I will post at a later date, and from there to a lesson on stellar evolution. You could discuss why there are no red or brown dwarfs in the models. This is because even the brightest and nearest red dwarfs are too small to see without telescopes, so they are not included in planetarium software such as Stellarium. This can lead into an activity on measuring the distances to stars, such as my Parallax lesson plan (https://spacedoutclassroom.com/2012/12/07/the-parallax-method/) or the Distance Modulus Method (https://spacedoutclassroom.com/?s=distance+modulus).

Doing great! Students charting out the change in the stars’ apparent positions as the observer moves.
At the end, you will have some nice models to display in your classroom for Parent – Teacher nights or STEAM Showcases. As always, if you use this lesson, feel free to modify it any way you want and let me know how it goes.
Here is a PDF version of the final lesson plan:
Constellation in a Box-David Black

Completed boxes for Scorpio and Gemini, with distortion diagrams included.

A row of completed constellation boxes at American Academy of Innovation.

Grateful for sharinng this